Slika:Milankovitch Variations.png
Pojdi na navigacijo
Pojdi na iskanje
Višja ločljivost ni na voljo.
Milankovitch_Variations.png (479 × 363 točk, velikost datoteke: 32 KB, MIME-vrsta: image/png)
Povzetek
| Opis |
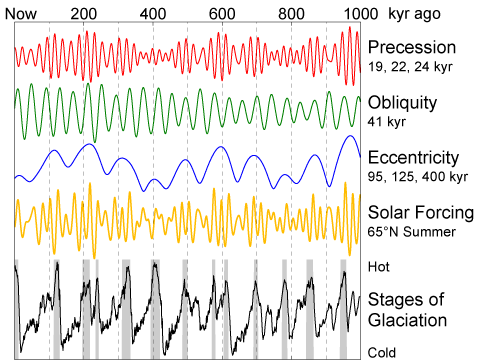
English: This figure shows the variations in Earth's orbit, the resulting changes in solar energy flux at high latitude, and the observed glacial cycles.
According to Milankovitch Theory, the precession of the equinoxes and the apsides, variations in the tilt of the Earth's axis (obliquity) and changes in the eccentricity of the Earth's orbit are responsible for causing the observed 100 kyr cycle in ice ages by varying the amount of sunlight received by the Earth at different times and locations, particularly high northern latitude summer. These changes in the Earth's orbit are the predictable consequence of interactions between the Earth, its moon, and the other planets. The orbital data shown are from Quinn et al. (1991). Principal frequencies for each of the three kinds of variations are labeled. The solar forcing curve (aka "insolation") is derived from July 1st sunlight at 65 °N latitude according to Jonathan Levine's insolation calculator [1]. The glacial data are from Lisiecki and Raymo (2005) and gray bars indicate interglacial periods, defined here as deviations in the 5 kyr average of at least 0.8 standard deviations above the mean. |
| Datum | 11. februar 2006 (datum naložitve) |
| Vir | lastno delo |
| Avtor | This image was produced by Robert A. Rohde from publicly available data, and is incorporated into the Global Warming Art project. |
| Druge različice | Izpeljana dela te datoteke: Variacions de Milankovitch.png |
References
- Lisiecki, L. E., and M. E. Raymo (2005), "A Pliocene-Pleistocene stack of 57 globally distributed benthic δ18O records." Paleoceanography 20, PA1003, doi:10.1029/2004PA001071 (alternative full text link: [2][mrtva povezava]).
- Quinn, T. R., S. Tremaine, and M. Duncan (1991), "A Three Million Year Integration of the Earth's Orbit." The Astronomical Journal 101, pp. 2287-2305, doi:10.1086/115850.

|
To grafiko je mogoče poustvariti z uporabo vektorske grafike kot SVG-datoteko. To ima več prednosti; več informacij je na razpolago na strani Commons:Media for cleanup. Če je SVG-oblika te datoteke že na razpolago, jo, prosimo, naložite. Potem, ko boste SVG naložili, to predlogo zamenjajte z izrazom {{vector version available|ime nove slike.svg}}.
|
Licenca
Image from Global Warming Art
This image is an original work created for Global Warming Art. Please refer to the image description page for more information.

|
Ta dokument je dovoljeno kopirati, razširjati in/ali spreminjati pod pogoji Licence GNU za prosto dokumentacijo, različica 1.2 ali katera koli poznejša, ki jo je objavila ustanova Free Software Foundation; brez nespremenljivih delov ter brez besedil na sprednji ali zadnji platnici. Kopija licence je vključena v razdelek Licenca GNU za prosto dokumentacijo. |
| Datoteka je objavljena pod licenco Creative Commons Priznanje avtorstva-Deljenje pod enakimi pogoji 3.0 Brez predelav. | ||
| ||
| Ta oznaka dovoljenja je bila datoteki dodana kot del posodobitve licence GFDL. |
Zgodovina datoteke
Kliknite datum in čas za ogled datoteke, ki je bila takrat naložena.
| Datum in čas | Sličica | Velikost | Uporabnik | Komentar | |
|---|---|---|---|---|---|
| trenutno | 12:35, 11. februar 2006 | | 479 × 363 (32 KB) | wikimediacommons>David Legrand | == Description == This figure shows the variations in Earth's orbit, the resulting changes in solar energy flux at high latitude, and the observed glacial cycles. According to Milankovitch Theory, the precession of the [[ |
Uporaba datoteke
Datoteko uporablja naslednja 1 stran: