Slika:Prime number theorem ratio convergence.svg
Pojdi na navigacijo
Pojdi na iskanje

Velikost tega predogleda PNG datoteke SVG: 250 × 160 točk. Druge ločljivosti: 320 × 205 točk | 640 × 410 točk | 1.024 × 655 točk | 1.280 × 819 točk | 2.560 × 1.638 točk.
Izvorna datoteka (Datoteka SVG, nominalno 250 × 160 pikslov, velikost datoteke: 87 KB)
Povzetek
| Opis |
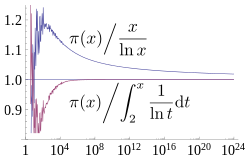
English: A plot showing how two estimates described by the prime number theorem, and converge asymptotically towards , the number of primes less than x. The x axis is and is logarithmic (labelled in evenly spaced powers of 10), going up to 1024, the largest for which is currently known. The former estimate converges extremely slowly, while the latter has visually converged on this plot by 108. Source used to generate this chart is shown below. |
| Datum | |
| Vir | lastno delo |
| Avtor | Dcoetzee |
| SVG razvoj |


Licenca
Jaz, imetnik avtorskih pravic na tem delu, ga objavljam pod naslednjo licenco:
| Datoteka je na voljo pod licenco Creative Commons Univerzalna izročitev v javno domeno CC0 1.0 | |
| Oseba, ki je delo povezala s tem dovoljenjem, je dala svoje delo v javno domeno z opustitvijo vseh svojih pravic do dela po vsem svetu pod avtorskim pravom, vključno z vsemi povezanimi in sorodnimi pravicami, v obsegu, kot ga dopušča zakonodaja. Delo lahko kopirate, spreminjate, razširjate in izvajate, tudi v gospodarske namene, ne da bi morali zaprositi za dovoljenje.
|
Source
All source released under CC0 waiver.
Mathematica source to generate graph (which was then saved as SVG from Mathematica):
(* Sample both functions at 600 logarithmically spaced points between \
1 and 2^40 *)
base = N[E^(24 Log[10]/600)];
ratios = Table[{Round[base^x],
    N[PrimePi[Round[base^x]]/(base^x/(x*Log[base]))]}, {x, 1,
    Floor[40/Log[2, base]]}];
ratiosli =
  Table[{Round[base^x],
    N[PrimePi[
       Round[base^x]]/(LogIntegral[base^x] - LogIntegral[2])]}, {x,
    Ceiling[Log[base, 2]], Floor[40/Log[2, base]]}];
(* Supplement with larger known PrimePi values that are too large for \
Mathematica to compute *)
LargePiPrime = {{10^13, 346065536839}, {10^14, 3204941750802}, {10^15,
     29844570422669}, {10^16, 279238341033925}, {10^17,
    2623557157654233}, {10^18, 24739954287740860}, {10^19,
    234057667276344607}, {10^20, 2220819602560918840}, {10^21,
    21127269486018731928}, {10^22, 201467286689315906290}, {10^23,
    1925320391606803968923}, {10^24, 18435599767349200867866}};
ratios2 =
  Join[ratios,
   Map[{#[[1]], N[#[[2]]]/(#[[1]]/(Log[#[[1]]]))} &, LargePiPrime]];
ratiosli2 =
  Join[ratiosli,
   Map[{#[[1]], N[#[[2]]]/(LogIntegral[#[[1]]] - LogIntegral[2])} &,
    LargePiPrime]];
(* Plot with log x axis, together with the horizontal line y=1 *)
Show[LogLinearPlot[1, {x, 1, 10^24}, PlotRange -> {0.8, 1.25}],
 ListLogLinearPlot[{ratios2, ratiosli2}, Joined -> True],
 LabelStyle -> FontSize -> 14]
LaTeX source for labels:
$$ \left.{\pi(x)}\middle/{\frac{x}{\ln x}}\right. $$
$$ \left.{\pi(x)}\middle/{\int_2^x \frac{1}{\ln t} \mathrm{d}t}\right. $$
These were converted to SVG with [1] and then the graph was embedded into the resulting document in Inkscape. Axis fonts were also converted to Liberation Serif in Inkscape.
Zgodovina datoteke
Kliknite datum in čas za ogled datoteke, ki je bila takrat naložena.
| Datum in čas | Sličica | Velikost | Uporabnik | Komentar | |
|---|---|---|---|---|---|
| trenutno | 14:07, 21. marec 2013 | | 250 × 160 (87 KB) | wikimediacommons>Dcoetzee | Change n to x to match article |
Uporaba datoteke
Datoteko uporablja naslednja 1 stran: